Let's perform a z-test for proportions, two samples: Researchers want to test the effectiveness of a new anti-anxiety medication. In clinical testing, 64 out of 200 people taking the medication report symptoms of anxiety. Of the people receiving a placebo, 92 out of 200 report symptoms of anxiety. Is the medication working any differently than the placebo? Test this claim using alpha = 0.05.
| Steps for z-Test for Proportions, Two Samples |
|---|
|
1. Define Null and Alternative Hypotheses 2. State Alpha 3. State Decision Rule 4. Calculate Test Statistic 5. State Results 6. State Conclusion |
Let's begin.
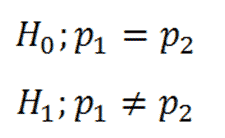
1. Define Null and Alternative Hypotheses

|
Figure 1. |
|---|
2. State Alpha
Alpha = 0.05
3. State Decision Rule
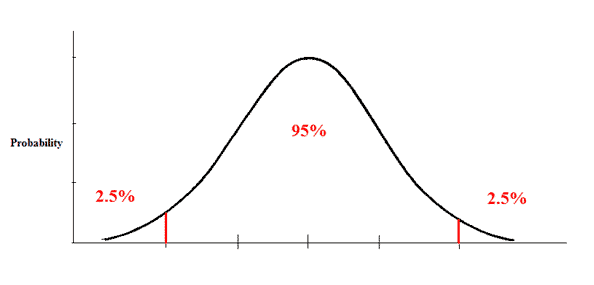
Using an alpha of 0.05 with a two-tailed test, we would expect our distribution to look something like this:

|
Figure 2. |
|---|
Here we have 0.025 in each tail. Looking up 1 - 0.025 in our z-table, we find a critical value of 1.96. Thus, our decision rule for this two-tailed test is:
If Z is less than -1.96, or greater than 1.96, reject the null hypothesis.
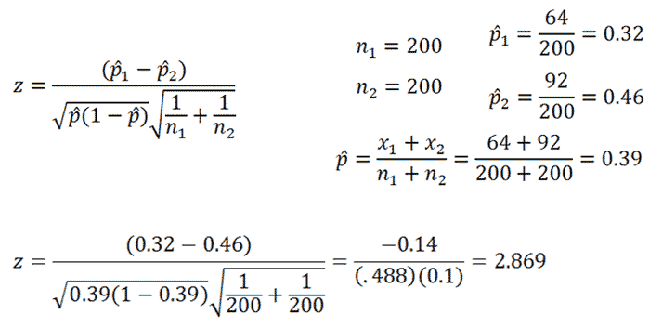
4. Calculate Test Statistic

|
Figure 3. |
|---|
5. State Results
z = 2.869
Result: Reject the null hypothesis.
6. State Conclusion
There was a significant difference in effectiveness between the medication group and the placebo group, z = -2.869, p < 0.05.