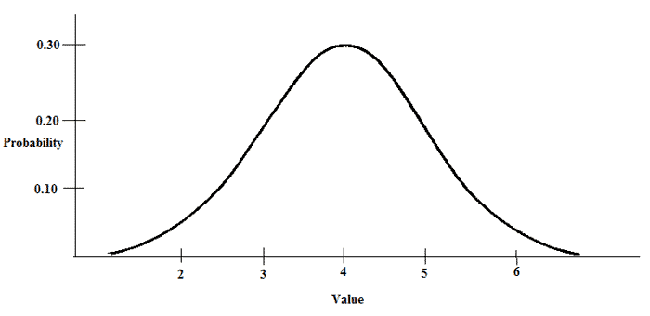
Letís say we have a random variable, x, distributed as such:

|
Figure 1. |
|---|
You can see from the distribution that x has a mean of 4, and a standard deviation of 1. I want to know: What percentage of scores fall above 4.25?

|
Figure 2. |
|---|
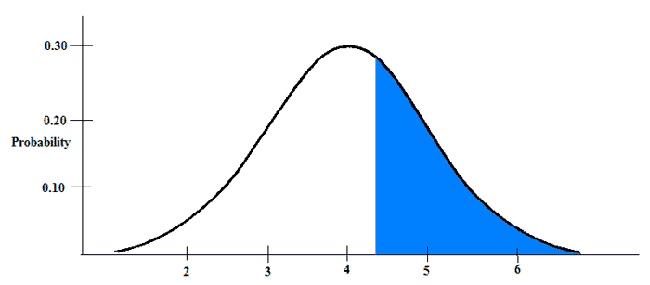
Or basically, what falls in this blue area. Remember from the empirical rule that we know what probabilities are associated with different areas of the normal distribution. We can use this information to find the percentage of scores above 4.25. First, we need to calculate a z-score:

|
Figure 3. |
|---|
With our z-score of 0.25, we now head to the z-table to find the area associated with it. The first thing you'll notice about the z table is that it's asking for the "area in body".

|
Figure 4. |
|---|
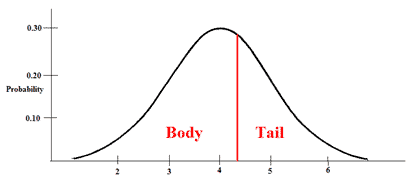
When you split a distribution into two parts, the smaller portion is the tail, while the larger portion is the body. We're trying to look up a tail, but this table only gives us body. To find the correct answer, we must first find the area in the body, then subtract it from 1. That will give us the area in the tail.
Looking up the area in the body for z = 0.25, we find a proportion of 0.5987. To find our final answer, we just have to make one quick change:
Area in Body = 0.5987
Area in Tail = 1.00-0.5987 = 0.4013
So, about 40% of scores fall above 4.25.