| Dispersion |
|---|
|
Dispersion refers to how spread out a data set is about the mean. |
Variance and Standard Deviation are two measures of dispersion within a data set. Below are the definitional formulas for finding both:

|
Figure 1. |
|---|
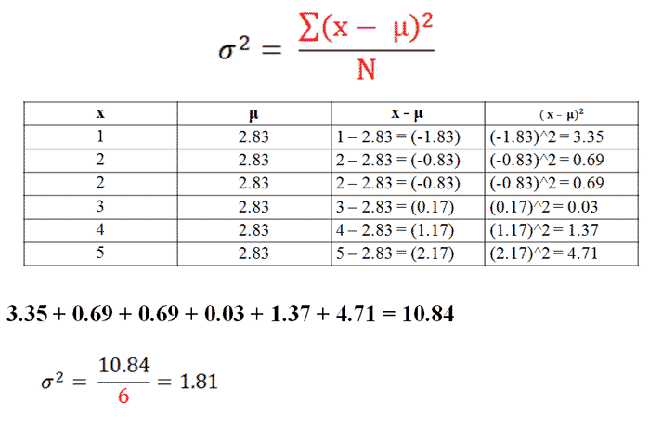
Using the definitional formula calculate variance for the data set 1, 2, 2, 3, 4, 5:

|
Figure 2. |
|---|
Here's what's happening here: first, we're finding out how much each individual number deviates from the mean.
We are then squaring all of those values (called "deviations"), and adding them together. We take the sum of all deviations and divide by the total number of scores to get a variance of 1.81.
To get the standard deviation of this data set, all we need to do is take the square root of 1.81. After doing so, we find the standard deviation to be 1.35.
Using the definitional formula can take a long time, so we usually use a shorter formula called the computational formula:

|
Figure 3. |
|---|
In this problem, N is the size of our data set(6). The other values are calculated like this:

|
Figure 4. |
|---|
After plugging in all the values, we again find a variance of 1.81, and a standard deviation of 1.35.