| Chi-Square Test for Independence |
|---|
|
The Chi-Square Test for Independence evaluates the relationship between two variables. It is a nonparametric test that is performed on categorical(nominal or ordinal) data. |
Let's try an example. 500 elementary school boys and girls are asked which is their favorite color: blue, green, or pink? Results are shown below:

|
Figure 1. |
|---|
Using alpha = 0.05, would you conclude that there is a relationship between gender and favorite color?
Let's perform a hypothesis test to answer this question.
| Steps for Chi-Square Test for Independence |
|---|
|
1. Define Null and Alternative Hypotheses 2. State Alpha 3. Calculate Degrees of Freedom 4. State Decision Rule 5. Calculate Test Statistic 6. State Results 7. State Conclusion |
1. Define Null and Alternative Hypotheses

|
Figure 2. |
|---|
2. State Alpha
alpha = 0.05
3. Calculate Degrees of Freedom
df = (rows – 1)(columns – 1)
df = (2 – 1)(3 – 1)
df = (1)(2) = 2
4. State Decision Rule
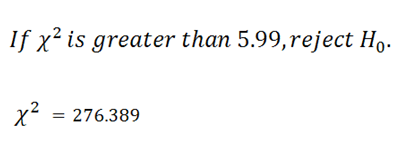
Using our alpha and our degrees of freedom, who look up a critical value in the Chi-Square Table. We find our critical value to be 5.99.

|
Figure 3. |
|---|
5. Calculate Test Statistic
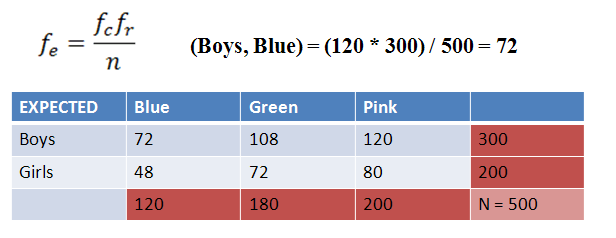
First, we need to calculate our expected values using the equation below. We find the expected values by multiplying each row total by each column total, and then diving by the total number of subjects. The calculations for boys who like blue are shown.

|
Figure 4. |
|---|
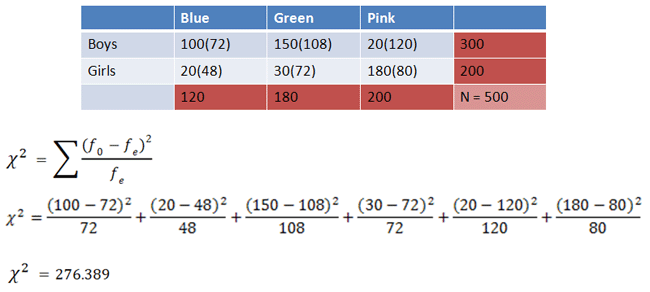
Next, we calculate our Chi-Square value by comparing observed values to expected values (shown in parentheses):

|
Figure 5. |
|---|
6. State Results

|
Figure 6. |
|---|
Reject the null hypothesis.
7. State Conclusion
In the population, there is a relationship between gender and favorite color.