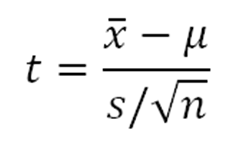
When performing any type of test or analysis using a Z-score, it is required that the population standard deviation already be known. In real life, this is hardly ever the case. It is almost impossible for us to know the standard deviation of the population from which our sample is drawn.
| Studentís t-Distribution |
|---|
|
We use Studentís t-distribution to perform an analysis when we donít know the population standard deviation, or when or sample size is unreasonably small. |

|
Figure 1. |
|---|
Studentís t-Distribution has n - 1 degrees of freedom.
Remember that we are no longer given population standard deviation. Instead, we must estimate it with sample standard deviation. Sample standard deviation, itself is a random variable. The proof for degrees of freedom is far beyond the scope of this lecture. Just try to understand that by calculating sample standard deviation, it is given a fixed value and thus one less value is free to vary.
These degrees of freedom change how the probability distribution looks. The probability distribution of t has more dispersion than the normal probability distribution associated with z.
When performing tests using t, we expect the probability distribution to look slightly different, so we must use a different t table (click to open) to calculate areas associated with different areas of the graph when taking degrees of freedom into account.