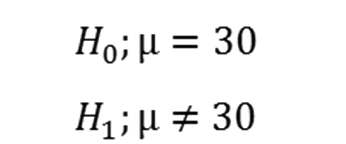
A new medication that claims to improve typing ability is currently being tested. The average person types at 30 wpm(words per minute) with a standard deviation of 16. The medication is expected to increase average wpm to 46. A sample of 16 individuals is taken to determine if the medication improves typing ability. Use alpha = .05 to test this claim.
Let’s go ahead and assume that the medication works and really does increase wpm to 46. What is the probability of us correctly concluding this with our statistical test?

|
Figure 1. |
|---|
| Power |
|---|
|
Power is the probability of correctly rejecting the null hypothesis. |
| Beta(ß) |
|---|
|
Beta(ß) is the probability of incorrectly retaining the null hypothesis. |
For this example, let's first calculate the standard error of the mean so we can draw the distribution:

|
Figure 2. |
|---|
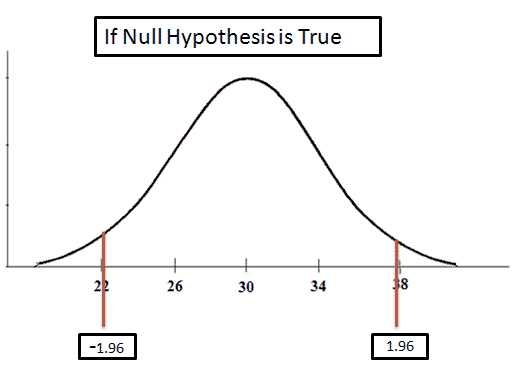
Now, let's draw the distribution:

|
Figure 3. |
|---|
If the null hypothesis is true, we expect to calculate a z that is somewhere between -1.96 and 1.96.

|
Figure 4. |
|---|
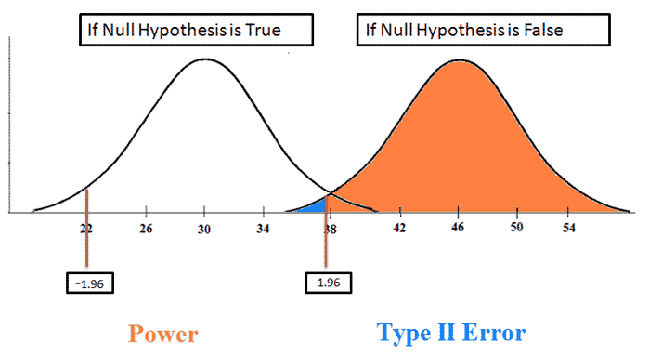
This new distribution(on the right) is what it would look like if the distribution really had a mean of 46. In this picture, the orange area refers to our power, while the blue area refers to our probability of making a Type II Error, assuming that the null hypothesis is false.

|
Figure 5. |
|---|
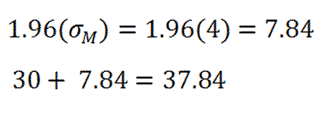
The z-score of 1.96 means that we are 1.96 standard errors above the mean. 1.96 refers to the value 37.84. We can now use 37.84 to calculate what the z-score would be for the graph on the right:

|
Figure 6. |
|---|
Looking up 2.04 in our z-table we find the area in the body to be 0.9793. This means:
Power = 0.9793
Type II Error = = 1 - 0.9793 = 0.0207
There is about a 98% of us correctly rejecting the null hypothesis, given that it is false. There is a 2% chance of us making a Type II Error.