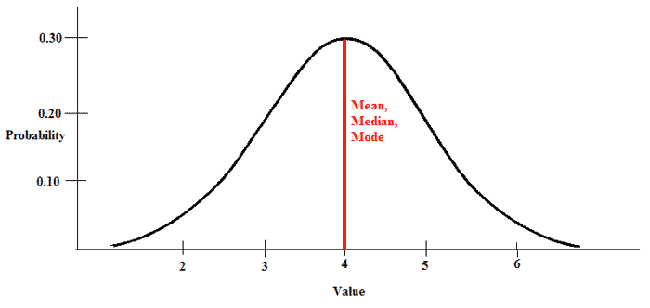
The distributions of most continuous random variables will follow the shape of the normal curve.

|
Figure 1. |
|---|
On the normal curve, mean, median, and mode all exist at the center.

|
Figure 2. |
|---|
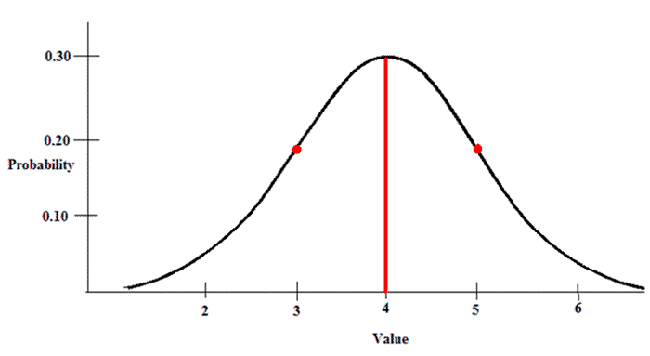
The graph changes direction at inflection points. These first points mark the distance of one standard deviation from the mean.

|
Figure 3. |
|---|
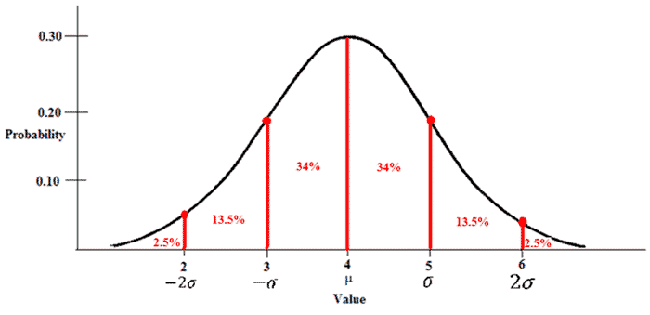
| The Empirical Rule |
|---|
|
The empirical rule states that: 68% of all values fall within 1 standard deviation of the mean. 95% of all values fall within 2 standard deviations of the mean. 99.7% of all values fall within 3 standard deviations of the mean. |