| Mann-Whitney U-Test |
|---|
|
The Mann-Whitney U-Test is a version of the independent samples t-Test that can be performed on ordinal(ranked) data. |
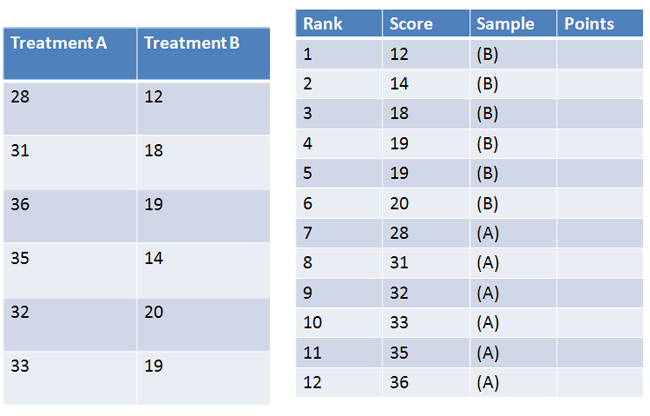
Ordinal data is displayed in the table below. Is there a difference between Treatment A and Treatment B using alpha = 0.05?

|
Figure 1. |
|---|
Let's test to see if there is a difference with a hypothesis test.
| Steps for Mann-Whitney U-Test |
|---|
|
1. Define Null and Alternative Hypotheses 2. State Alpha 3. State Decision Rule 4. Calculate Test Statistic 5. State Results 6. State Conclusion |
1. Define Null and Alternative Hypotheses

|
Figure 2. |
|---|
2. State Alpha
alpha = 0.05
3. State Decision Rule
When you have a sample size that is greater than approximately 30, the Mann-Whitney U statistic follows the z distribution. Here, our sample is not greater than 30. However, I will still be using the z distribution for the sake of brevity. Keep this requirement in mind!
We look up our critical value in the z-Table and find a critical value of plus/minus 1.96.
If z is less than -1.96, or greater than 1.96, reject the null hypothesis.
4. Calculate Test Statistic
First, we must rank all of our scores and indicate which group the scores came from:

|
Figure 3. |
|---|
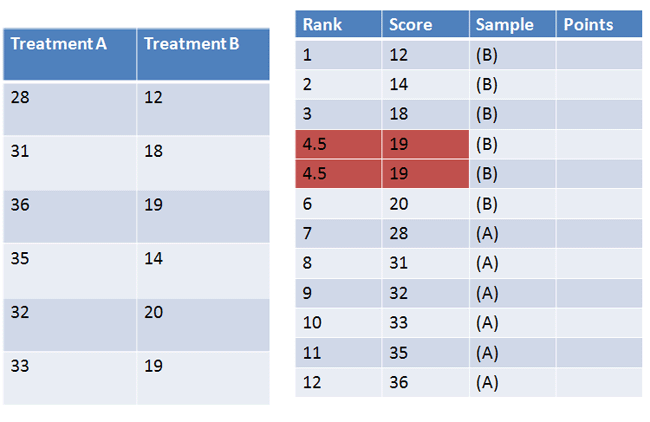
If there is a tie, as shown below, we average the ranks:

|
Figure 4. |
|---|
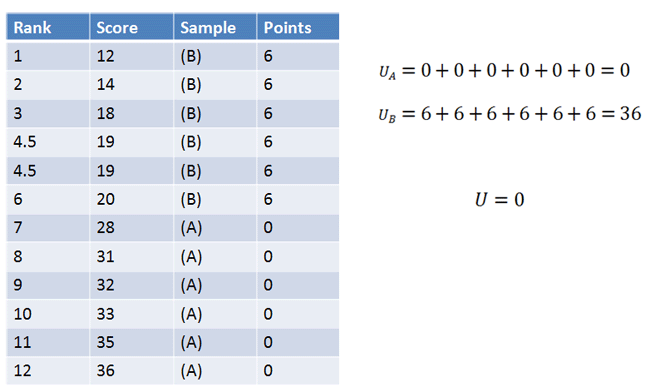
Next, we give every "B" group one point for every "A" group that is above it. We also give every "A" group one point for every "B" group that is above it. We then add together the points for "A" and "B", and take the smaller of those two values which we call "U".

|
Figure 5. |
|---|
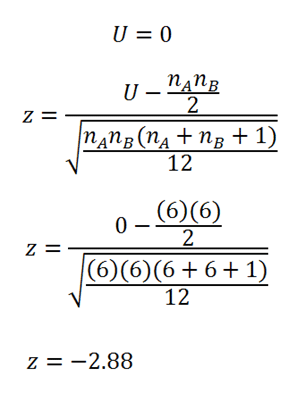
The "U" score is then used to calculate the z statistic:

|
Figure 6. |
|---|
5. State Results
If z is less than -1.96, or greater than 1.96, reject the null hypothesis.
z = -2.88
Reject the null hypothesis.
6. State Conclusion
There is a difference between the ranks of the two treatments, z = -2.88, p < .05.