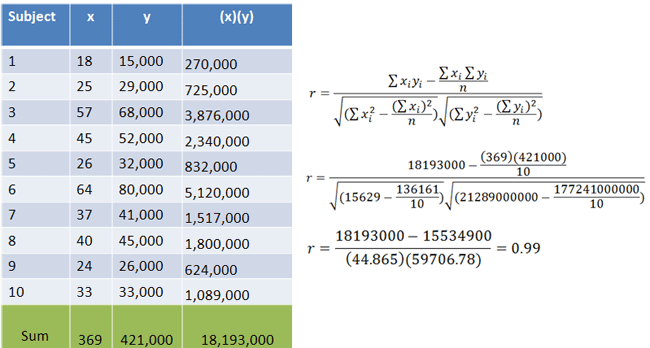
In a previous lecture on Pearson's r, we found two sets of data to be highly correlated:
|
Figure 1. |
|---|
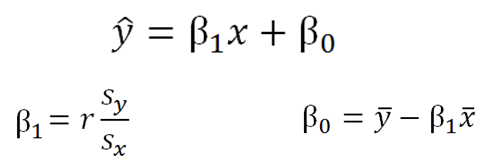
If we know that two variables are strongly correlated, we can use one variable to predict the other using the following equations:
|
Figure 2. |
|---|
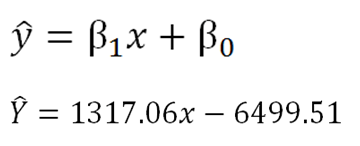
Here, we first calculate beta1 and beta0 and place them in the top equation. Then, if we plug an x into the equation, we can predict what our y value will be.
The stronger your correlation (that is, the closer r is to -1 or 1), the more accurate your prediction will be.
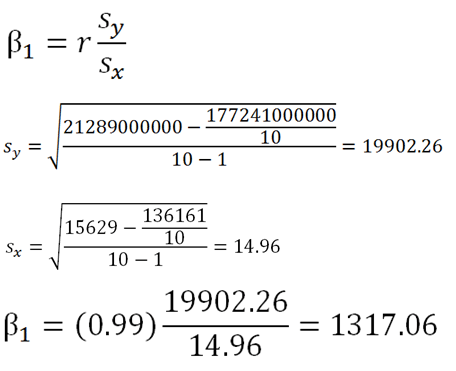
First, we solve for beta1:
|
Figure 3. |
|---|
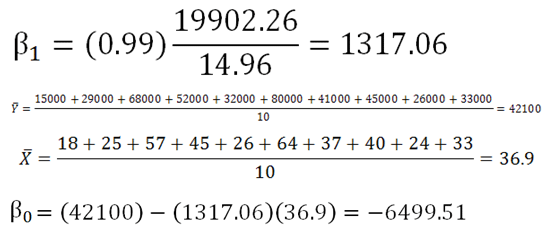
We then use beta1's value to solve for beta0:
|
Figure 4. |
|---|
Now, putting those values into the original equation, we have our completed regression equation:
|
Figure 5. |
|---|
Predict the yearly income of someone who is 33 years old.

|
Figure 6. |
|---|
We would expect someone who is 33 years old to make approximately $36,963 a year.