| Analysis of Variance (ANOVA) |
|---|
|
ANOVA is a statistical method used to compare the means of two or more groups. |
An ANOVA has factors(variables), and each of those factors has levels:
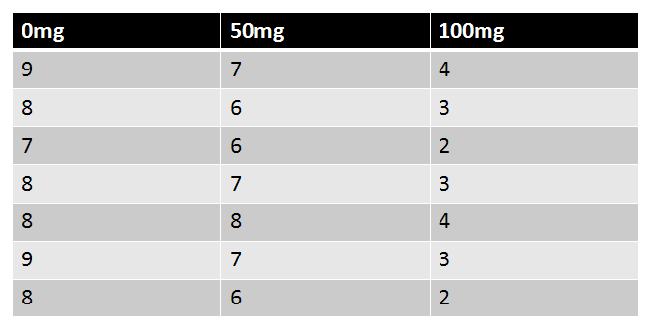
|
Figure 1. |
|---|
There are several different types of ANOVA:
| One-Way ANOVA |
|---|
|
A One-Way ANOVA is an ANOVA with one factor with at least two levels. Levels are independent. |
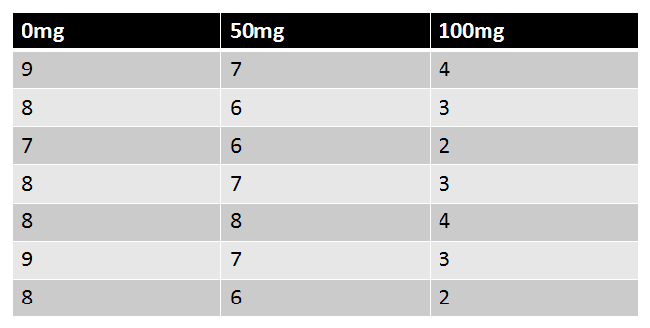
|
Figure 2. |
|---|
| Repeated-Measures ANOVA |
|---|
|
A Repeated-Measures ANOVA is an ANOVA with one factor with at least two levels. Levels are dependent. |
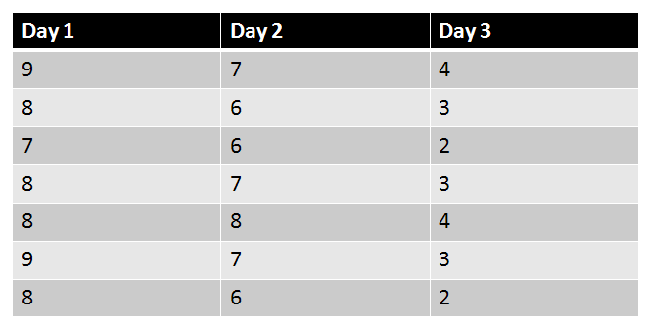
|
Figure 3. |
|---|
| Factorial ANOVA |
|---|
|
A Factorial ANOVA is an ANOVA with two or more factors (each of which with at least two levels), levels can be either independent, dependent, or both (mixed). |
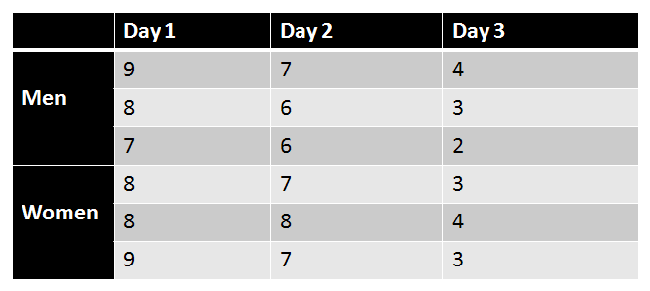
|
Figure 4. |
|---|
There are four main assumptions of an ANOVA:
| Normality of Sampling Distribution of Means |
|---|
|
The distribution of sample means is normally distributed. |
| Independence of Errors |
|---|
|
Errors between cases are independent of one another. |
| Absence of Outliers |
|---|
|
Outlying scores have been removed from the data set. |
| Homogeneity of Variance |
|---|
|
Population variances in different levels of each independent variable are equal. |
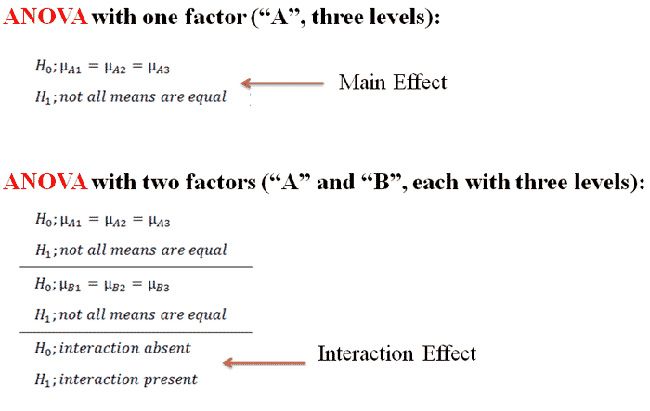
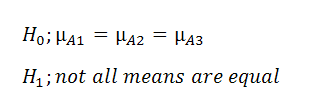
Hypotheses in ANOVA depend on the number of factors you're dealing with:
|
Figure 5. |
|---|
Effects dealing with one factor are called main effects. Effects dealing with multiple factors are called interaction effects.
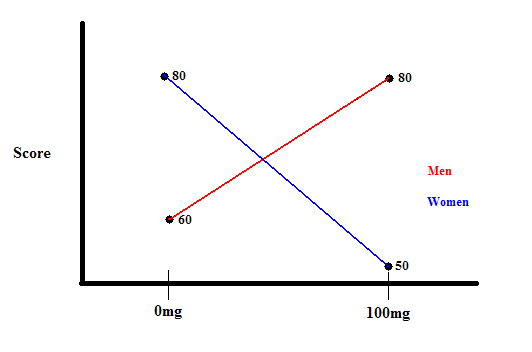
Here's an example of an interaction effect in an ANOVA: Below we have a Factorial ANOVA with two factors: dosage(0mg and 100mg) and gender(men and women) . In the 0mg dosage condition, men have a mean of 60 while women have a mean of 80. In the 100mg dosage condition, men have a mean of 80 while women have a mean of 50. This could be represented in a graph like this:
|
Figure 6. |
|---|
Dosage and gender are interacting because the effect of one variable depends on which level you're at of the other variable. For example, men with a lower dosage have lower scores than women, but men with a higher dosage have higher scores than women.
|
Figure 7. |
|---|
If we reject the null hypothesis in an ANOVA, all we know is that there is a difference somewhere among the groups. Additional tests called Post Hoc tests must be done to determine where differences lie.
When performing an ANOVA, we calculate an "F" statistic. It is similar to other statistics such a "z" and "t".

|
Figure 8. |
|---|
If there are no treatment differences (that is, if there is no actual effect), we expect F to be 1. If there are treatment differences, we expect F to be greater than 1.
The F statistic has its own one-tailed distribution, much like how the "z" and "t" statistics have their own separate distributions.