Let's perform an independent samples t-test: A statistics teacher wants to compare his two classes to see if they performed any differently on the tests he gave that semester. Class A had 25 students with an average score of 70, standard deviation 15. Class B had 20 students with an average score of 74, standard deviation 25. Using alpha 0.05, did these two classes perform differently on the tests?
| Steps for Independent Samples t-Test |
|---|
|
1. Define Null and Alternative Hypotheses 2. State Alpha 3. Calculate Degrees of Freedom 4. State Decision Rule 5. Calculate Test Statistic 6. State Results 7. State Conclusion |
Let's begin.
1. Define Null and Alternative Hypotheses
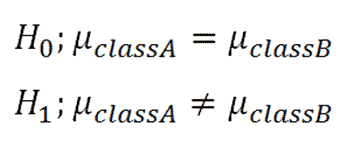
|
Figure 1. |
|---|
2. State Alpha
Alpha = 0.05
3. Calculate Degrees of Freedom
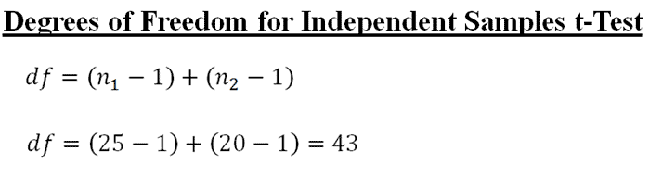
|
Figure 2. |
|---|
4. State Decision Rule
Using an alpha of 0.05 with a two-tailed test with 43 degrees of freedom, we would expect our distribution to look something like this:
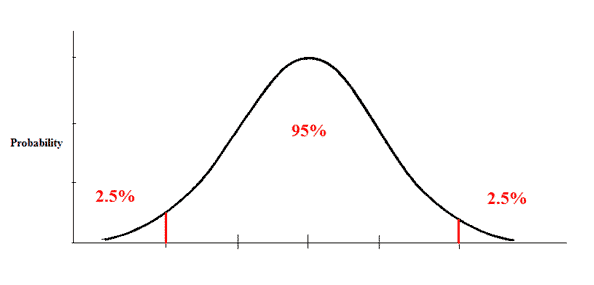
|
Figure 3. |
|---|
Use the t-table to look up a two-tailed test with 43 degrees of freedom and an alpha of 0.05. We find a critical value of 2.0167. Thus, our decision rule for this two-tailed test is:
If t is less than -2.0167, or greater than 2.0167, reject the null hypothesis.
5. Calculate Test Statistic
The first step is to calculate the df and SS for each sample:
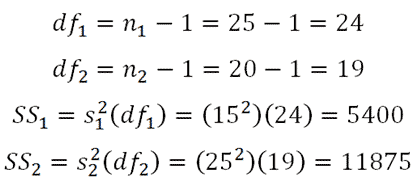
|
Figure 4. |
|---|
We then use that information to calculate the pooled variance:
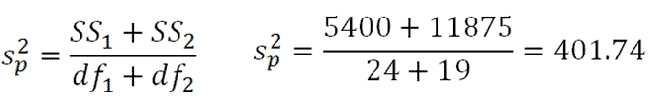
|
Figure 5. |
|---|
Finally, we can calculate our t value:
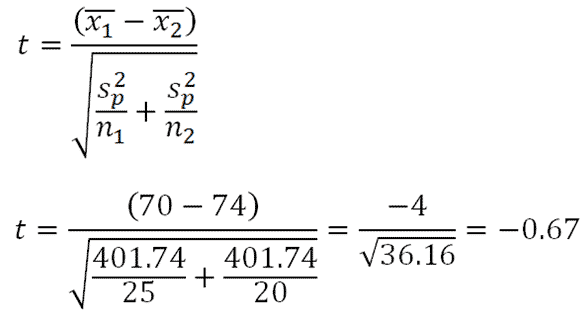
|
Figure 6. |
|---|
6. State Results
t = -0.67
Result: Do not reject the null hypothesis.
7. State Conclusion
There was no significant difference between the test performances of Class A and Class B, t = -0.67, p > 0.05.


 Facebook
 YouTube


 Home
Home
 Calculators
 Tutoring