| Chi-Square Test for Goodness of Fit |
|---|
|
The Chi-Square Test for Goodness of Fit tests claims about population proportions. It is a nonparametric test that is performed on categorical(nominal or ordinal) data. |
Let's try an example. In the 2000 U.S. Census, the ages of individuals in a small town were found to be the following:

|
Figure 1. |
|---|
In 2010, ages of n = 500 individuals from the same small town were sampled. Below are the results:

|
Figure 2. |
|---|
Using alpha = 0.05, would you conclude that the population distribution of ages has changed in the last 10 years?
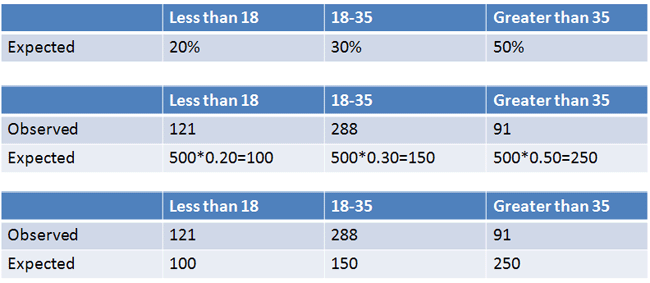
Using our sample size and expected percentages, we can calculate how many people we expected to fall within each range. We can then make a table separating observed values versus expected values:

|
Figure 3. |
|---|
Let's perform a hypothesis test on this new table to answer the original question.
| Steps for Chi-Square Test for Goodness of Fit |
|---|
|
1. Define Null and Alternative Hypotheses 2. State Alpha 3. Calculate Degrees of Freedom 4. State Decision Rule 5. Calculate Test Statistic 6. State Results 7. State Conclusion |
1. Define Null and Alternative Hypotheses

|
Figure 4. |
|---|
2. State Alpha
alpha = 0.05
3. Calculate Degrees of Freedom
df = k – 1, where k = your number of groups.
df = 3 – 1 = 2
4. State Decision Rule
Using our alpha and our degrees of freedom, who look up a critical value in the Chi-Square Table. We find our critical value to be 5.99.

|
Figure 5. |
|---|
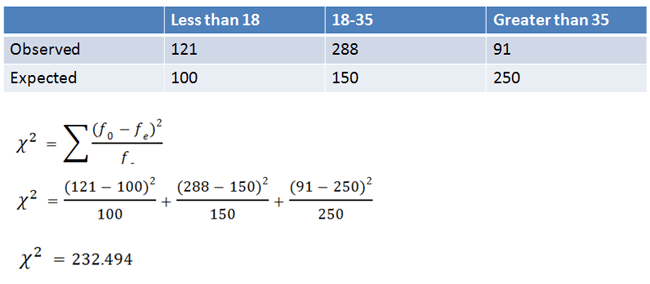
5. Calculate Test Statistic
The Chi-Square statistic is found using the following equation, where observed values are compared to expected values:

|
Figure 6. |
|---|
6. State Results

|
Figure 7. |
|---|
Reject the null hypothesis.
7. State Conclusion
The ages of the 2010 population are different than those expected based on the 2000 population.