| Friedman Test |
|---|
|
The Friedman Test is a version of the Repeated-Measures ANOVA that can be performed on ordinal(ranked) data. |
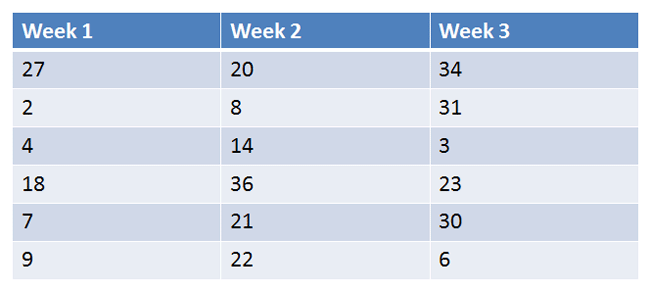
Ordinal data is displayed in the table below. Is there a difference between Weeks 1, 2, and 3 using alpha = 0.05?

|
Figure 1. |
|---|
Let's test to see if there are any differences with a hypothesis test.
| Steps for Friedman Test |
|---|
|
1. Define Null and Alternative Hypotheses 2. State Alpha 3. Calculate Degrees of Freedom 4. State Decision Rule 5. Calculate Test Statistic 6. State Results 7. State Conclusion |
1. Define Null and Alternative Hypotheses

|
Figure 2. |
|---|
2. State Alpha
alpha = 0.05
3. Calculate Degrees of Freedom
df = k – 1, where k = number of groups
df = 3 – 1 = 2
4. State Decision Rule
We look up our critical value in the Chi-Square Table and find a critical value of plus/minus 5.99.

|
Figure 3. |
|---|
5. Calculate Test Statistic
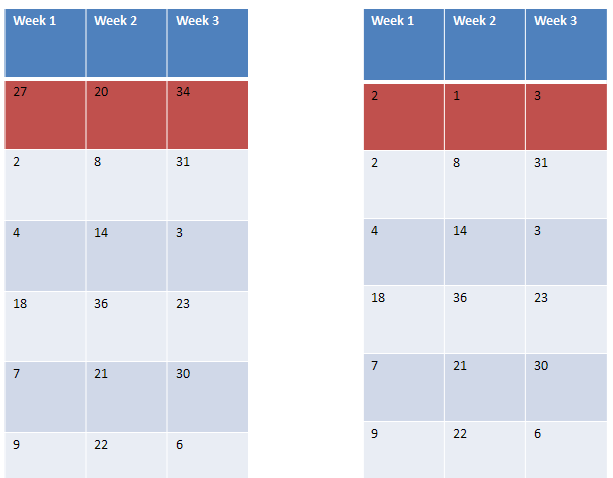
First, we must rank the scores of every subject, as shown below in red:

|
Figure 4. |
|---|
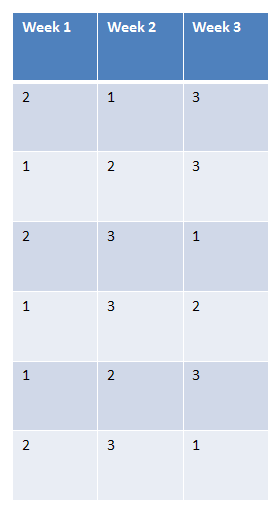
We then replace our original values with the rankings we've just found:

|
Figure 5. |
|---|
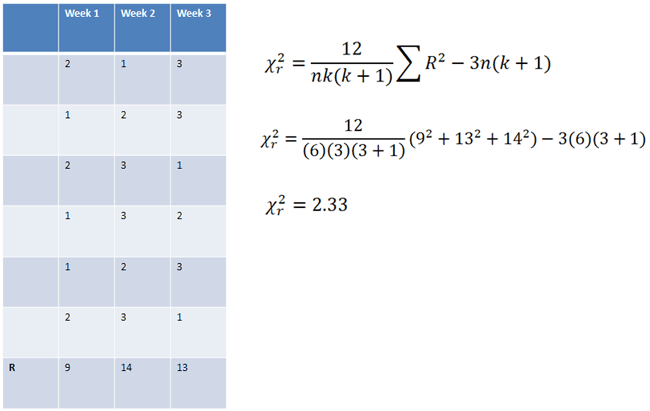
A Chi-Square value is then calculated using the sums of the ranks of each group:

|
Figure 6. |
|---|
6. State Results

|
Figure 7. |
|---|
Do not reject the null hypothesis.
7. State Conclusion

|
Figure 8. |
|---|