| Five Number Summary |
|---|
|
The Five Number Summary is a method for summarizing a distribution of data. The five numbers are the minimum, the first quartile(Q1) value, the median, the third quartile(Q3) value, and the maximum. |
Give the five number summary for the following data set:
1, 2, 2, 2, 3, 3, 4, 5, 5, 5, 6, 6, 6, 6, 7, 8, 8, 9, 27
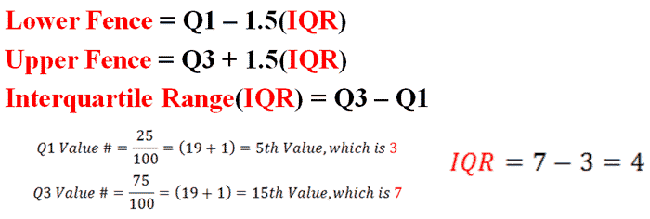
The first thing you might notice about this data set is the number 27. This is very different from the rest of the data. It is an outlier and must be removed. When it comes to outliers, we remove everything that isn't between a lower fence and an upper fence:

|
Figure 1. |
|---|
Here, we first find the First Quartile(Q1) and the Third Quartile(Q3) values. We then use those two values to find the Interquartile Range(IQR). Finally, we can use those values to find the lower and upper fences. Plugging in the values, we find a lower fence of -3, and an upper fence of 13. We now remove the 27 from the original data set, because it falls outside of this range. Our new data set is:
1, 2, 2, 2, 3, 3, 4, 5, 5, 5, 6, 6, 6, 6, 7, 8, 8, 9
Now, we should easily be able to find our five number summary:
1. Minimum - 1
2. First Quartile(Q1) - 3
3. Median - 5
4. Third Quartile(Q3) - 7
5. Maximum - 9
| Boxplot |
|---|
|
A boxplot is a visual representation of a five number summary |
Here is a boxplot of our five number summary:

|
Figure 2. |
|---|