Here are some extra problems involving z-scores:
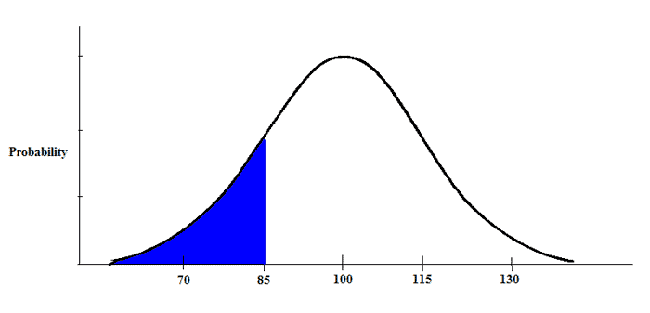
In the United States, the average IQ is 100, with a standard deviation of 15. What percentage of the population would you expect to have an IQ lower than 85?
|
Figure 1. |
|---|
Basically, we're trying to find what area corresponds to the blue tail shown above. First, we calculate the z-score.

|
Figure 2. |
|---|
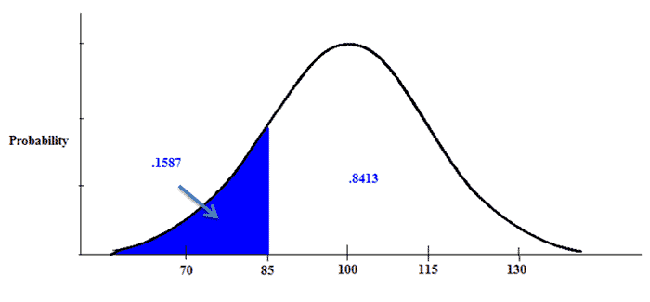
We then look up this z-score in our z-table. After doing so, we find the area in the body is .8413. We subtract that value from 1 to find the area in the tail.
|
Figure 3. |
|---|
Our answer is .1587. About 16% of the population has an IQ score lower than 85.
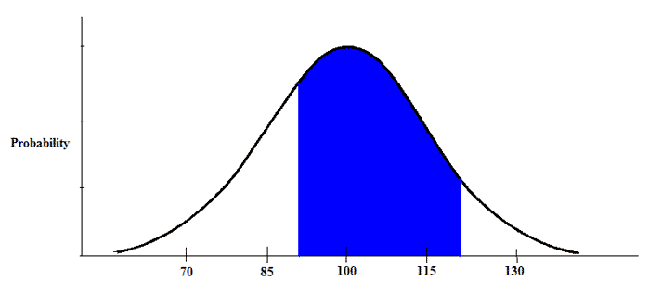
What if the question was like this: In the United States, the average IQ is 100, with a standard deviation of 15. What percentage of the population would you expect to have an IQ between 90 and 120?
|
Figure 4. |
|---|
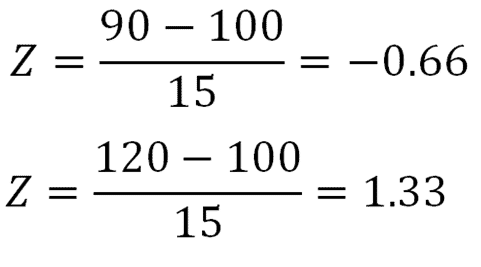
We're trying to find what area corresponds to the blue area shown above. First, we calculate both z-scores.
|
Figure 5. |
|---|
In order to find the area between those two z-scores, we must first look up each z-score in the Z table (click to open). We find that the area in the body for 0.66 is 0.7454, and the area in the body for 1.33 is 0.9082.
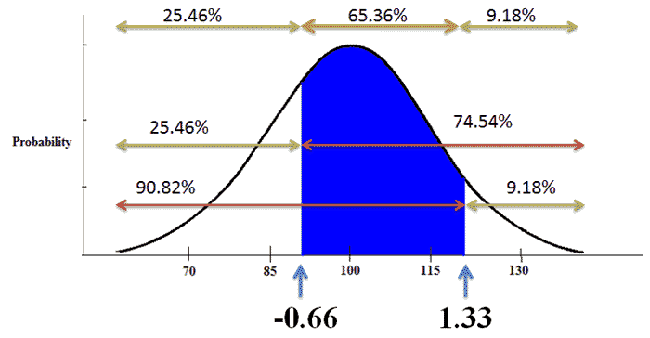
|
Figure 6. |
|---|
Using this information and what we know about the normal curve, we find that 65.36% of the population has an IQ score between 90 and 120.