| Distribution of the Sample Mean |
|---|
|
The distribution of the sample mean is a probability distribution for all possible values of a sample mean, computed from a sample of size n. |
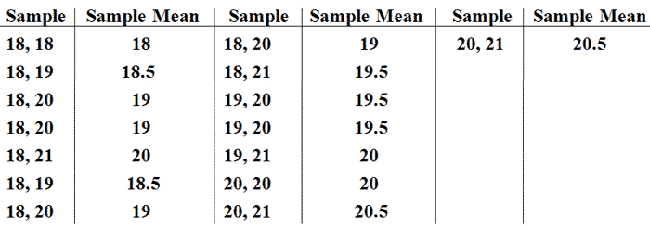
For example: A statistics class has six students, ages displayed below. Construct a sampling distribution of the mean of age for samples (n = 2).
Ages: 18, 18, 19, 20, 20, 21
First, we find the mean of every possible pairing where n = 2:

|
Figure 1. |
|---|
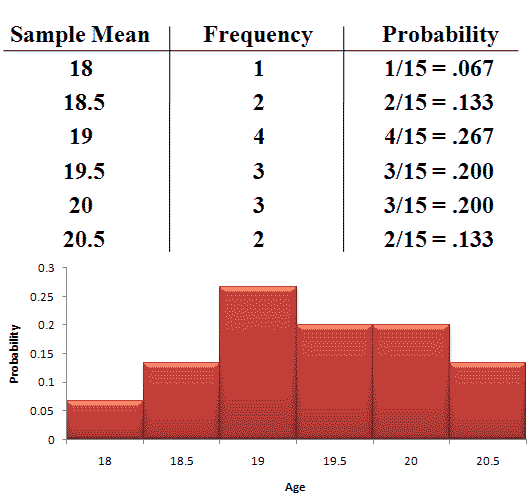
Next, we create a frequency distribution for the new sample means:

|
Figure 2. |
|---|
This is the distribution of our sample mean, where n = 2.

|
Figure 3. |
|---|
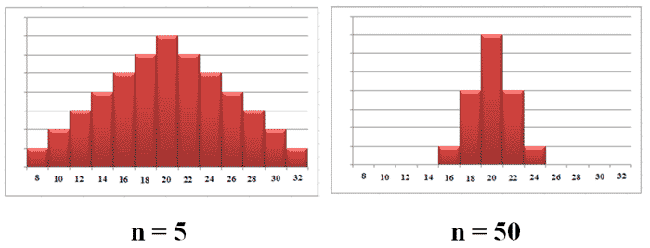
As sample size increases, standard deviation decreases.
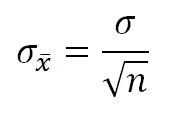
The standard deviation of the sampling distribution is also known as the standard error of the mean:

|
Figure 4. |
|---|