|
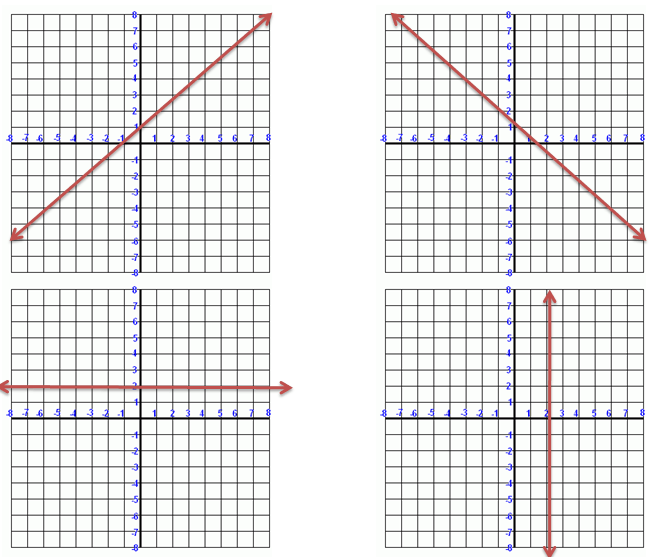
Figure 1. |
|---|
Above we have graphs of four lines. We can classify them according to their slopes:
| Positive Slope |
|---|
|
"y" increases as you move from left to right 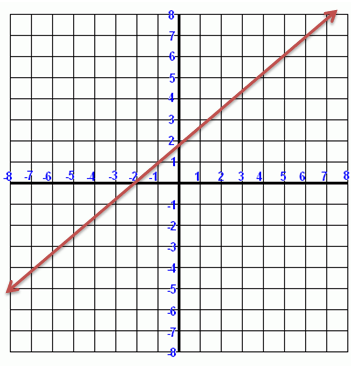
|
| Negative Slope |
|---|
|
"y" decreases as you move from left to right 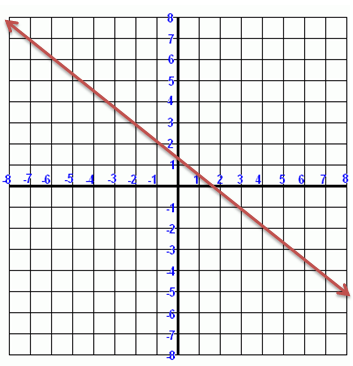
|
| No Slope |
|---|
|
"y" remains the same as you move from left to right 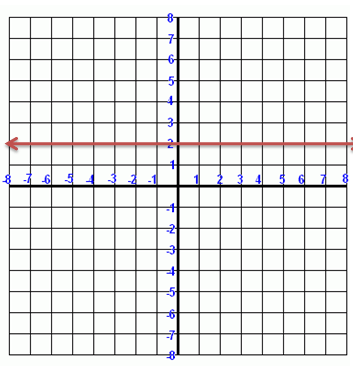
|
| Undefined Slope |
|---|
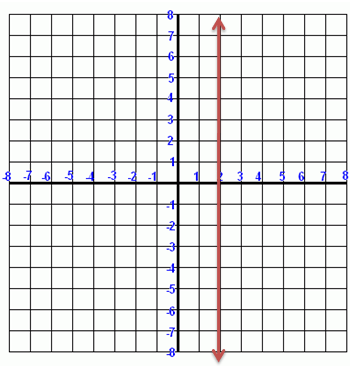
|