We use the z-Test for Proportions to test if two proportions are different from one another. After the z-test, confidence intervals can be constructed to estimate how large that difference is.
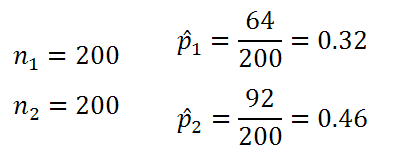
Imagine we already have this data from a previous z-test:

|
Figure 1. |
|---|
Construct a 95% confidence interval for the proportion difference.

|
Figure 2. |
|---|
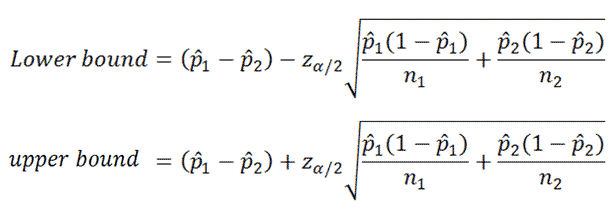
Above are the equations for the lower and upper bounds of the confidence interval.

|
Figure 3. |
|---|
We already know most of the variables in the equation, but what should we put for z?
We want to create a 95% confidence interval. That means we have an alpha of 0.05(5%) which is split into two equal tails. This 2.5% refers to the value we look up in the z-table in order to find the z-score we need to plug into the equation. When we look up 1 - 0.025, we find a z score of 1.96.

|
Figure 4. |
|---|
We are 95% confident that the mean difference between the two proportions is between 0.045 and 0.235.