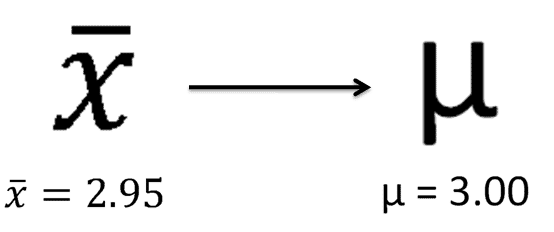
Remember that the value of any statistic that estimates the value of a parameter is called a point estimate.

|
Figure 1. |
|---|
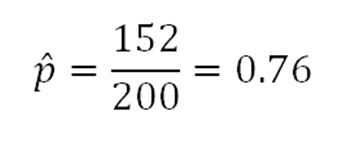
Here's an example involving proportions: In a recent poll of 200 households, it was found that 152 households had at least one computer. Estimate the proportion of households in the population that have at least one computer.

|
Figure 2. |
|---|
This is just a single estimate, so it’s probably off from the actual value of the population proportion. Because of this, we’re going to create a confidence interval to give a more realistic impression of what the actual population proportion value may be.
There are two requirements for constructing meaningful confidence intervals about a population proportion:

|
Figure 3. |
|---|
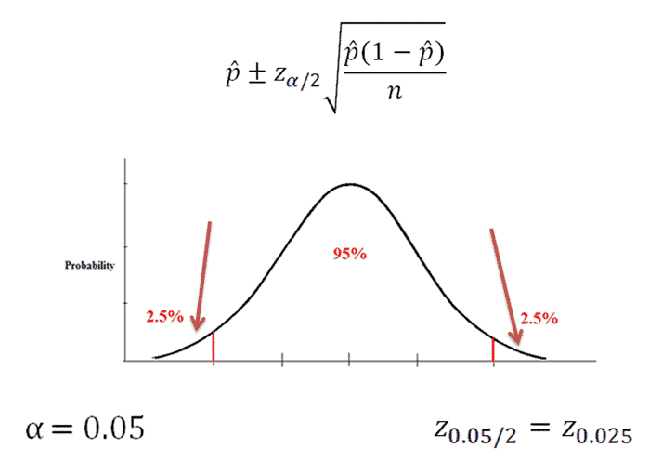
Now, let's construct a 95% confidence interval to estimate the previous population proportion.

|
Figure 4. |
|---|
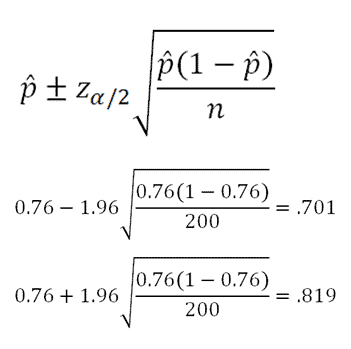
We're trying to create 95% confidence interval. That means we have an alpha of 0.05(5%) which is split into two equal tails. This 2.5% refers to the value we look up in the z-table in order to find the z-score we need to plug into the equation. We find a z of "1.96" to plug into the equation.

|
Figure 5. |
|---|
We are 95% confident that the proportion of households in the population with at least one computer is between .701 and .819.